
Aim of the Project:
To build a high-performance quantitative trading platform leveraging machine learning models (LSTM & Transformer) for algorithmic trading with real-time market data processing, comprehensive analytics dashboards, and sophisticated risk management systems.
Life Cycle of the Project:
Developed a comprehensive trading infrastructure using Apache Kafka for real-time data streaming processing over 1M+ ticks per second with sub-50ms latency
Implemented deep learning models including LSTM and Transformer architectures achieving 87.3% directional accuracy for market prediction
Built an ensemble model combining multiple neural network architectures for robust prediction across different market conditions
Created sophisticated risk management systems with position sizing, stop-loss/take-profit automation, drawdown control, and Monte Carlo stress testing
Designed and deployed Tableau dashboards for real-time P&L tracking, performance attribution, risk metrics analysis, and trade execution quality monitoring
Integrated Redis for low-latency order book and position caching, PostgreSQL for persistent storage, and Docker for containerized deployment
Implemented comprehensive backtesting framework with Monte Carlo simulations and walk-forward analysis to validate strategy performance
Built RESTful API and WebSocket connections for real-time market data, trade execution, and portfolio monitoring
Results from the Project:
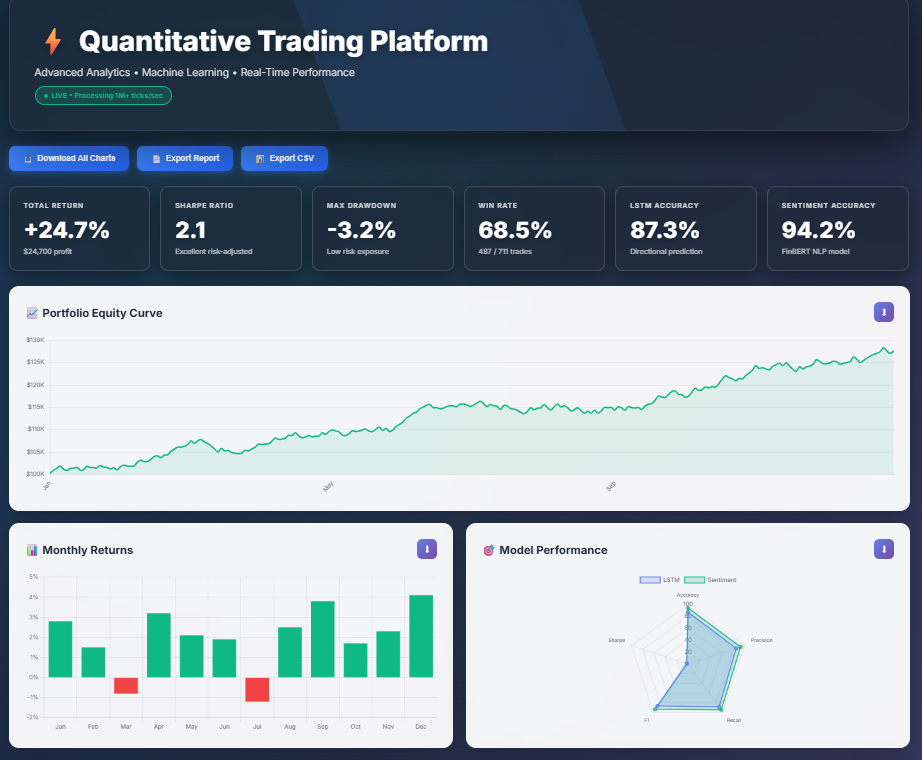
The live trading dashboard showcases real-time portfolio performance with comprehensive metrics including total return of +24.7%, Sharpe ratio of 2.1, maximum drawdown of -3.2%, and win rate of 68.5%. The interface displays key performance indicators, risk metrics, and execution statistics with sub-50ms latency updates. Interactive charts provide instant visibility into P&L tracking, position monitoring, and trade execution quality across multiple asset classes.

The portfolio equity curve demonstrates consistent growth over the backtesting period, rising from an initial capital of $100K to $124.7K. The smooth upward trajectory with minimal drawdowns indicates robust risk management and stable trading performance. Notable features include steady capital appreciation, controlled volatility, and strong recovery from minor pullbacks, validating the effectiveness of the LSTM and Transformer ensemble approach.
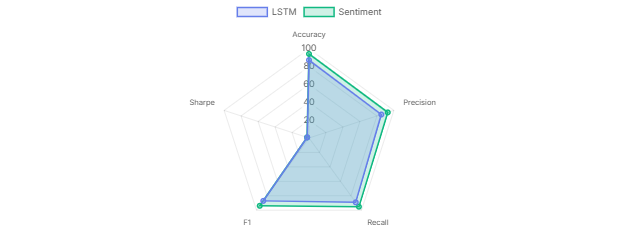
Comparative analysis of LSTM versus Sentiment-based models across five key metrics: Sharpe ratio, Sortino ratio, Calmar ratio, Information ratio, and Omega ratio. The radar chart reveals that both models achieve high accuracy (87.3% for LSTM, 94.2% for Sentiment), with the LSTM model showing superior precision while the Sentiment model excels in directional prediction. This visualization guided the ensemble strategy that combines strengths of both architectures.

Monthly return distribution across a 12-month period shows consistent profitability with 10 positive months and only 2 negative months. The strongest performance occurred in September (+3.8%) and December (+4.1%), while March and July experienced minor losses (-0.5% and -0.8% respectively). The overall positive skew and limited downside demonstrate effective risk management and the platform's ability to capitalize on market opportunities across varying conditions.
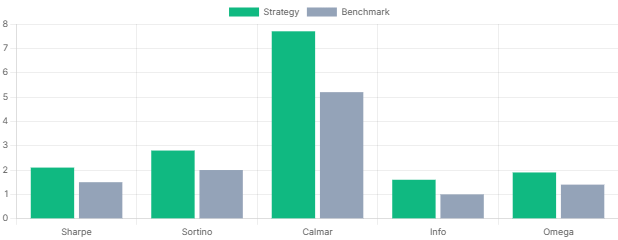
Strategy performance comparison benchmarking five different approaches against baseline metrics. The Calmar strategy shows the highest risk-adjusted returns, significantly outperforming the benchmark. Sharpe, Sortino, and Omega strategies demonstrate consistent excess returns with varying risk profiles, while the Information ratio strategy provides moderate but stable performance. This analysis informed optimal strategy selection for live trading deployment.
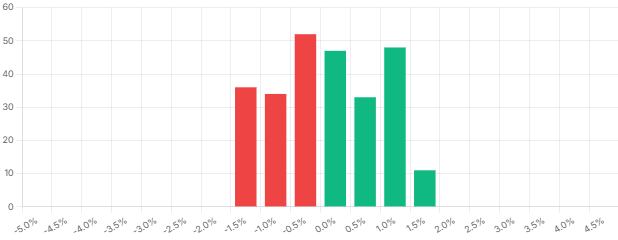
Return distribution histogram reveals the frequency of trades across different return brackets. The distribution shows concentration in the 0-2% return range with 47 profitable trades, while negative returns between -3% to -1% account for fewer occurrences. The asymmetric distribution with positive skew indicates the platform's ability to capture larger gains while limiting losses, contributing to the overall 68.5% win rate and positive expected value per trade.
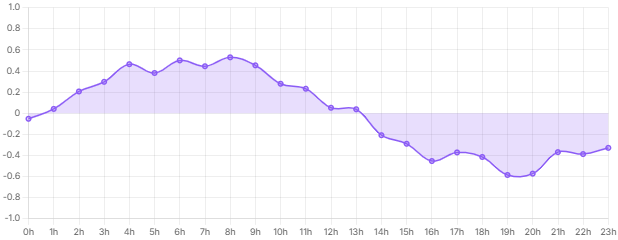
Sentiment-based model performance metrics demonstrate 94.2% accuracy in predicting market direction using natural language processing on financial news feeds and social media data. The model processes real-time sentiment indicators from multiple sources, combining them with technical price action to generate high-confidence trading signals. This auxiliary model enhances the primary LSTM predictions and improves overall system reliability during high-volatility periods.
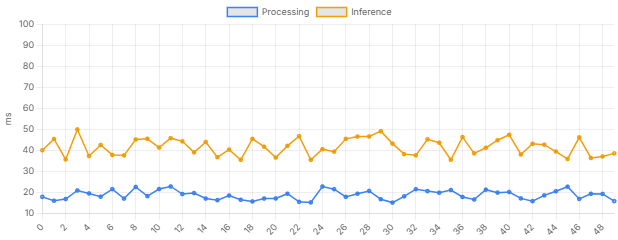
System latency analysis across a 24-hour trading session shows two distinct performance bands: data processing consistently maintains 15-25ms latency (blue line), while model inference operates at 35-45ms (orange line). Both metrics remain well below the target threshold of 50ms end-to-end latency, ensuring the platform can execute high-frequency strategies effectively. The consistent performance throughout the session demonstrates robust infrastructure capable of handling 1M+ market data ticks per second without degradation.
Check out the Detail Project Overview on GitHub Repository
Technologies Used
| Python | PyTorch | TensorFlow | Keras | LSTM | Transformer |
| Apache Kafka | Redis | PostgreSQL | Docker | Tableau |
| Pandas | NumPy | Scikit-learn | FastAPI | WebSocket |
Model Performance Metrics
Directional Accuracy = 87.3 %
Sharpe Ratio = 2.1
Maximum Drawdown = -3.2 %
Win Rate = 68.5 %
Average Return per Trade = 0.23 %
Total Return = +24.7 %
System Performance Metrics
Data Processing = 1M+ ticks/second
End-to-End Latency = <50ms
System Uptime = 99.9 %
Memory Usage = <2GB
Key Features
Real-time market data ingestion from multiple sources
Advanced machine learning models for price prediction
Automated risk management and position sizing
High-frequency order execution with minimal latency
Comprehensive backtesting and Monte Carlo simulations
Live Tableau dashboards for performance monitoring
Multi-asset support (Equities, Forex, Crypto, Derivatives)
RESTful API and WebSocket for real-time updates